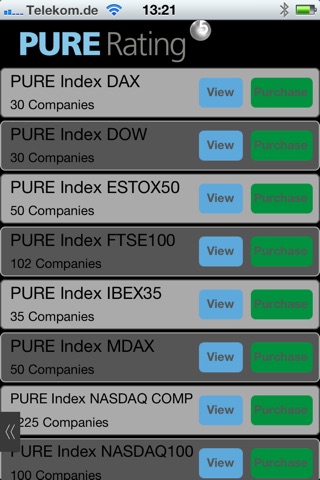
This is an app that may help you creating high financial returns.
Value Investing is a strategy of applying a targeted selection of shares of undervalued companies to achieve superior returns.
To find these undervalued stocks or companies, use is made of this particular fundamental analysis called value investing.
The methods of value-oriented investing make use of the analysis of corporate data, specifically amongst others the current and past book value and return on invested capital, earnings per share, sales and cash flow.
Probably the best known and perhaps the most successful investor is Warren Buffett.
We collect for you all worldwide relevant data from thousands of companies within indices which are examined by us and calculate the most significant results with specially developed algorithms.
You may choose between an analysis of only one company (stock search function) or analyses of all companies belonging solely to stock indices, which we call the PURE Index:
PURE Index AEX
PURE Index ASX200
PURE Index BEL20
PURE Index CACC40
PURE Index DAX 30
PURE Index DOW
PURE Index ESTOX50
PURE Index FTSE100
PURE Index IBEX35
PURE Index MDAX
PURE Index NASDAQ COMP
PURE Index NASDAQ100
PURE Index NIKKEI225
PURE Index S&P500
PURE Index SDAX
PURE Index TECDAX
and many more.
So with a single click you get all the analyzes of hundreds or even thousands of companies.
Manual analysis of this complexity and extent is nearly impossible. A manual analysis for only one company, providing help is given by a computerized spreadsheet, would take about 30 minutes to complete. For the S & P 500, with 500 companies alone would take about 250 hours, i.e. completion within more than 10 days, if you worked 7 days a week, 24 hours a day.
You will find more detailed information under www.value-investing-strategy.com.
The app shows you the analysed growth rates of the most important enterprise data within the the last 10, 5, 3 years and the last year.
This is illustrated in simple colors and thus helps you to make your decisions at one glance.
Furthermore, we show you whether the current share price is attractive compared to the calculated future stock price and if the company’s debt is within limits.
The share price/earning ratio will be compared to the bond price/earning ratio, as well the current beta of the share is shown, which gives you information about the volatility.
You can also see information about the stock chart, company news, officers and directors, insider trading and the company’s webpage.
There will also be detailed information and instructions on all app-pages.
You will be subscribing to a non-renewing subscription of 60 days by in-app purchase of a single analysis or multiple analyses as you selected and you will be able to view your purchased analyses anytime updated daily.


